Welcome to EDA Explorer
A tool for the analysis of Electrodermal Activity (EDA) data
Find Peaks
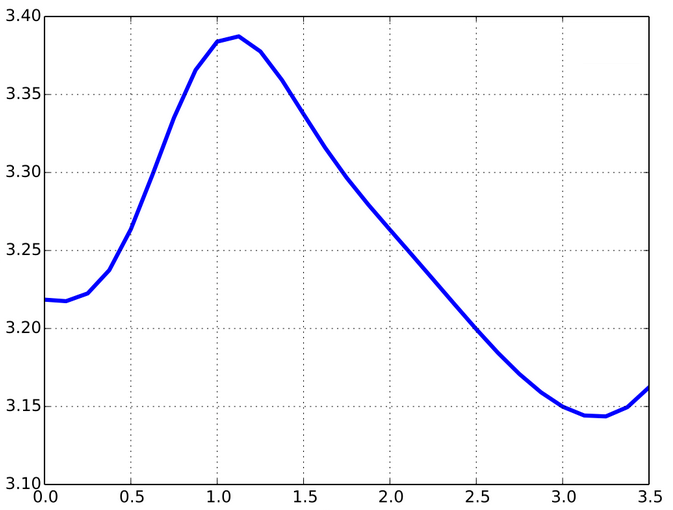
When you feel an increase in stress, cognitive load, or emotion, your body will begin to sweat, causing you to produce a Skin Conductance Response (SCR) like the one pictured. Our algorithm can detect these SCRs or "peaks" in your EDA signal and compute features related to them, allowing you to perform machine learning on the computed features. You can also customize the peak detection parameters to suit your needs.
Find Noise
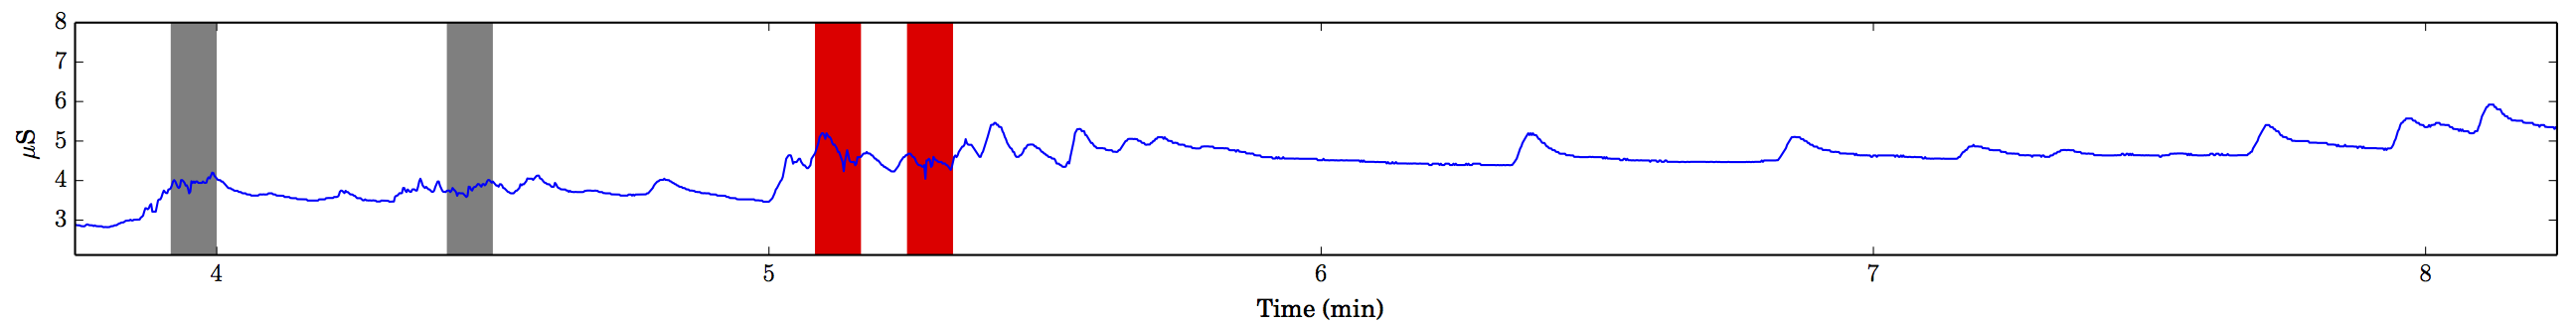
Often EDA is measured using a wearable device which allows data to be gathered as participants go about their normal daily routine. While this can be incredibly valuable, participants can easily introduce noise or "artifacts" into the EDA signal when they adjust the sensor, knock it against something, or place pressure on the device. We have trained a machine learning classifier than can detect noise within EDA signal with 95% accuracy on novel data. This website allows you to apply this classifier to each 5-second epoch of your data to determine if it contains noise or clean signal.
Label Epochs
In order to train our machine learning algorithms, we asked expert EDA researchers to label 5-second periods of EDA signal to determine if it contained peaks, noise, or clean signal. Our site provides this feature to you, allowing you to upload your own data and label it based on your own criteria. You can also invite other researchers to join your team account so that they can provide additional sets of labels for the same files. The labels can then be downloaded easily so that you can use them to train your own machine learning classifiers.